
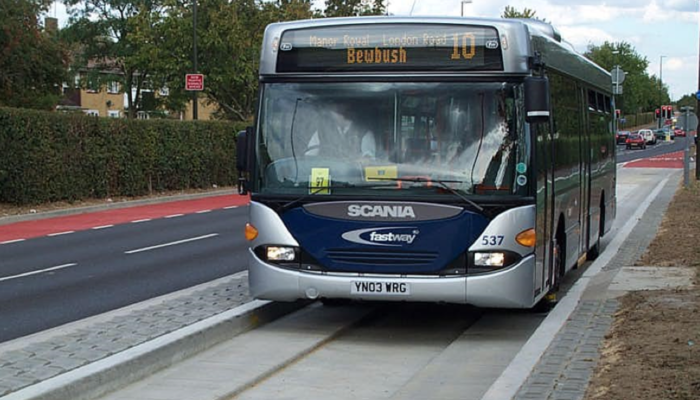
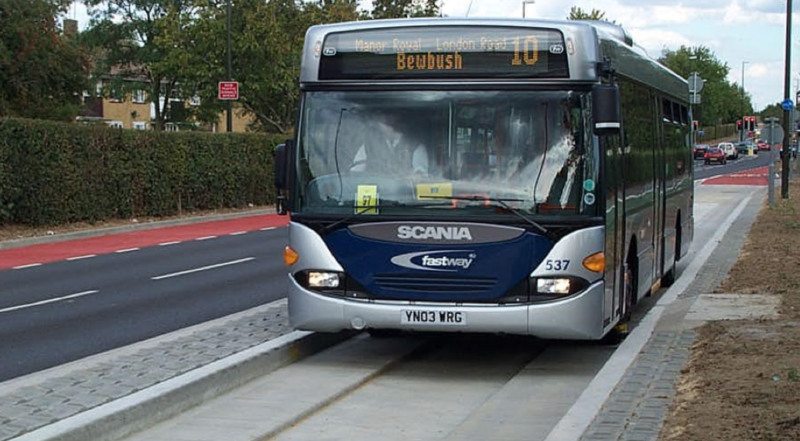
The Crawley FastWay scheme involved the delivery of a series of bus priority measures along two core routes linking Horley, Gatwick Airport and Crawley. Economic evaluation of the outturn costs and benefits shows that the scheme has delivered an economic return on investment at £4.67 for each £1 spent. The scheme has succeeded in attracting increasing numbers of passengers, exceeding targets, journey times have been reduced, service reliability is high and passenger satisfaction is over 90%. In addition, there is evidence to suggest that the scheme has also resulted in a decline in road traffic, achieving modal shift from car. The investment included the re-design of heavily trafficked roundabouts and existing signal-controlled junctions in order to provide reserved bus lanes and priority settings for FastWay services. Parts of the route also involved a segregated bus way with kerb guidance. The service on this route was planned to operate at 10 minute intervals in peak periods and every 20 minutes off-peak, giving 5 minute and 10 minute intervals respectively on the common sections of the route. The full case study can be accessed here.
Key Statistics
| Location: | Crawley and Horley urban area |
| Key Stakeholders: |
|
| Construction completion date: | 2003-2006 |
| Cost: | £38m |
Sources of funding
Funder |
Value |
|---|---|
| Public funding (DfT, West Sussex CC and Surrey CC): | £18m (2002) |
| Private funding (BAA, Go-Ahead, various development sites): | £14m (2002) |
Transport and the economy
Rationale for investment
The bus service had begun a downward spiral whereby falling patronage number led to a reduced bus service, which in turn led to a further reduction in patronage as the bus service could not be relied upon.
Issues identified with previous bus system:
- Low frequency of services, often requiring interchanging
- Long journey time due to low bus speeds and unreliability of services
- Poor vehicle design
- Fares perceived as too high
Scheme objectives
The objectives of the scheme were linked to West Sussex Local Transport Plan (LTP) objectives and Surrey LTP objectives. These are:
- Choice
- Safety
- Integration
- Economic performance
- Environmental
- Accessibility
Appraisal and selection
Scheme Development
Plans for Fastway were developed over the three years running up to 2000 involving assessment of the engineering and economic viability of the scheme.
In 1999 an initial proposal was submitted as part of the Provisional Local Transport Plan (LTP), and this was worked up in greater detail to develop a full project appraisal submitted as part of the Local Transport Plan for West Sussex in 2000.
Business case development
A scheme appraisal report for Fastway was produced by West Sussex County Council in 2000.
According to this business case appraisal, the Fastway scheme was expected to deliver a BCR of
1.94. This was based on a present value of benefits of £73 million and present value of costs of
£38 million, thus leading to a net present value of £36 million.
Since this appraisal was undertaken, the DfT methodology for estimating BCRs has changed and benefits and costs have been reclassified. Based on the current guidance, the net present value would stay the same but the ratio of benefits and costs would change, due to lower estimated costs, leading to a BCR of 4.67. This indicates high value for money.
The ex-ante business case is shown below. It shows that a large proportion of benefits correspond to benefits for car and bus users. These reflect time savings resulting from the scheme implementation. The exact assumptions behind these calculations are not explicitly described in the business case.
| Business case | Present value (2000 prices, £ million) | |
|---|---|---|
| Bus and Car user benefits | 46.1 | a |
| Freight benefits | 4.1 | b |
| Private sector revenue | 28.0 | c |
| Private sector operating costs | (26.6) | d |
| Private sector grant (paid to local authority) | (1.4) | e |
| Public sector cost | (11.1) | f |
| Indirect tax revenues | (5) | g |
| Benefits (old methodology) | 73.2 | (a+b+c+g) |
| Costs (old methodology) | 37.7 | (-d-f) |
| BCR (old methodology) | 1.94 | |
| Benefits (new methodology) | 45.2 | (a+b+c+d+e+g) |
| Costs (new methodology) | 9.7 | (-f-e) |
| BCR (new methodology) | 4.67 |
It is worth noting that the present value of benefits has been calculated over a 30-year appraisal period using a 6% discount rate. The guidance relating to the appropriate discount rate to apply has been updated in the latest WebTAG methodology, which recommends using a discount rate of 3.5%.
Monitoring plan description
Not available.
Implementation
Scheme delivery
The FastWay was delivered in three phases with the first services originally intended to be operational in 2002. The FastWay was ultimately delivered behind the original schedule, with the first services commencing in September 2003. The delays were largely attributed to difficulties in obtaining cooperation from utility companies to re-route pipes and cables which ran beneath the busway route. Other slight delays came from the required inspections of the busways, which at the time were subject to the same inspection requirements as railways.
Assurance processes
Not available.
Evaluating the investment
Performance evaluation
| KPI | Target (Quality Partnership agreement) | Actual data |
|---|---|---|
| Patronage growth | 10% in 10 years + 1% in bus mode share | 160% over 10 years |
| Traffic levels | Reduce traffic growth by 2.5% by 2006 | 19% reduction in traffic levels between 2006-2013 |
| Reliability | 95% of buses to operate within 5 minutes of timetable | Reliability between 90-95% |
| Journey times | Average reduction of 1 minute | Reduction in 9.5 min on average |
| Customer satisfaction | No specific target | Satisfaction between 60-95% depending on the category |
An ex-post evaluation of the scheme shows that the project is likely to have delivered high value for money despite cost overruns, however more data would be required to confirm this. This is because targets have been exceeded significantly and frequency has increased over time responding to demand growth, further reducing journey times and increasing benefits.
| Category | Targets | Ex-ante Business Case | Ex-post Business Case |
|---|---|---|---|
| Demand | 10% growth in 10 years | Increase in 5,500 trips per day by 2008 | 160% growth in demand (area not directly comparable with ex-ante business case) |
| Traffic | 2.5% | n/a | 19% decrease in traffic |
| Journey time | 1 min reduction | n/a | 9.5 min reduction |
| Capital costs | £24m | £24m | £38m |
| Operating costs | £1.16-£2.31m | n/a | |
| Value for money | - | 1.9 (old WebTAG methodology) 4.7 (new WebTAG methodology) (high value for money) | High value for money |
Process evaluation
Timing of activity
The FastWay was delivered in three phases with the first services originally intended to be operational in 2002. The FastWay was ultimately delivered behind the original schedule, with the first services commencing in September 2003. The delays were largely attributed to difficulties in obtaining cooperation from utility companies to re-route pipes and cables which ran beneath the busway route. Other slight delays came from the required inspections of the busways, which at the time were subject to the same inspection requirements as railways.
Project delivery
In terms of finances, the final cost of the FastWay exceeded the original budget. In the original business case produced in July 2000, the cost of the total capital costs of the FastWay were estimated at £23.9m. This figure was updated prior to work commencing in 2002 to £32m, and the final costs of delivery were around £38m. The over spend was due to both the delays experienced as well as inadequate project management processes. Some costs were recouped by adjusting the specification of the scheme in subsequent phases.
In terms of the scheme design, some elements of the scheme have not been as effective as expected. This is in part due to the fact that FastWay was one of the first BRT schemes built meaning that lessons could not be learned from others. In addition, the project was delivered with an engineering focus as opposed to an issues-led approach, meaning some elements were not optimised from a customer perspective.
Stakeholders and partnership working
Despite a large number of partners involved in the scheme, agreements were achieved without preventing progress of the project. The partners shared a common vision and various steering groups were established to address specific issues. In addition, the public was consulted and informed of the progress of the scheme.
An informal partnership agreement between Metrobus and West Sussex CC was put in place in relation to bus operations.
Unexpected outcomes
The flexibility of the BRT system to adapt routes to demand allowed route 20 to change as a result of residents’ feedback. This would have not been possible with a tram or light rail system.
A second important consequence of the scheme has been its positive impact on property prices and the attractiveness of housing in the area.
External factors
The growth of Gatwick Airport and the local economy is likely to have contributed to the growth in patronage. Another factor affecting demand is likely to be the reduction in frequency of other routes as a result of cuts in revenue support during the economic downturn, which did not affect FastWay.
Improvements since opening
Improvements to scheme
Since the opening of the scheme, frequency has steadily increased in response to demand growth. This has included the introduction of a 24 hour service.
Summary
The Crawley FastWay scheme involved the delivery of a series of bus priority measures along two core routes linking Horley, Gatwick Airport and Crawley. Economic evaluation of the outturn costs and benefits shows that the scheme has delivered an economic return on investment at £4.67 for each £1 spent.
Submit your Case Study
If you have a case study that you would like to be included on the Hub, please submit it using this form.